Troubleshooting HTTP with tcpdump in Docker
Today I decided to focus on something I take for granted, that possibly many other backend developers may not have ever used to help troubleshoot problems: tcpdump and wireshark. Coming from a systems and networking background into a software development role, I have used capture for troubleshooting networked applications I have developed. Today I will try to explain how you can setup a development environment that will allow you to use these tools to troubleshoot your application.
tcpdump
tcpdump is a command-line packet analyzer, which will dump traffic on a network. tcpdump takes in, amongst other things, a network interface, and a BPF expression. BPF stands for Berkeley Packet Filter and is a language specifically designed for expression of network traffic as filters.
Docker
Docker is a project that automates the deployment of applications inside of Linux
Containers. Part of the automation revolves around creation of a bridged network
interface which all of the containers running are attached to. This is handy
in that we are able to use tcpdump on the docker0 interface and watch all the
network traffic that is going from container to container, as well as host
to container.
wireshark
Wireshark is a very popular GUI network protocol analyzer which allows you to view and analyze a wide variety of protocols.
Setup
In order to start watching all the container network traffic you can run the following command on the container host:
sudo tcpdump -i docker0 tcp port 80 -w test.pcapWhat this command is doing is performing a capture on the docker0 interface
and filtering with the BPF expression tcp port 80 which filters just the
HTTP protocol traffic from the result set and then writes the Packet CAPture
data to a file called test.pcap.
Pcap is a pretty simple file format, explained in depth here, but high level contains a global header, and headers followed by corresponding data chunks. The Pcap headers contain information about endianess, timestamp in seconds and microseconds, the size of the following data and the length of the captured packet. The data section following the header is the raw data bytes captured.
Analysis
Now that we are running our tcp command to capture the port 80 traffic on the
docker0 bridged network interface, we perform some action in the web
application that we want to troubleshoot. When we perform the task we wish
to troubleshoot, we stop tcpdump by signalling and interupt, and our pcap
file is written to disk.
Note: If you have an entire stack of services running, using this process will actually capture ALL the requests/responses throughout your whole stack in the order written to the network interface. This is extremely helpful to figure out problems with many services running. Very helpful.
Now that we have a capture we can open said capture file in a wireshark so we can easily follow the http conversation:
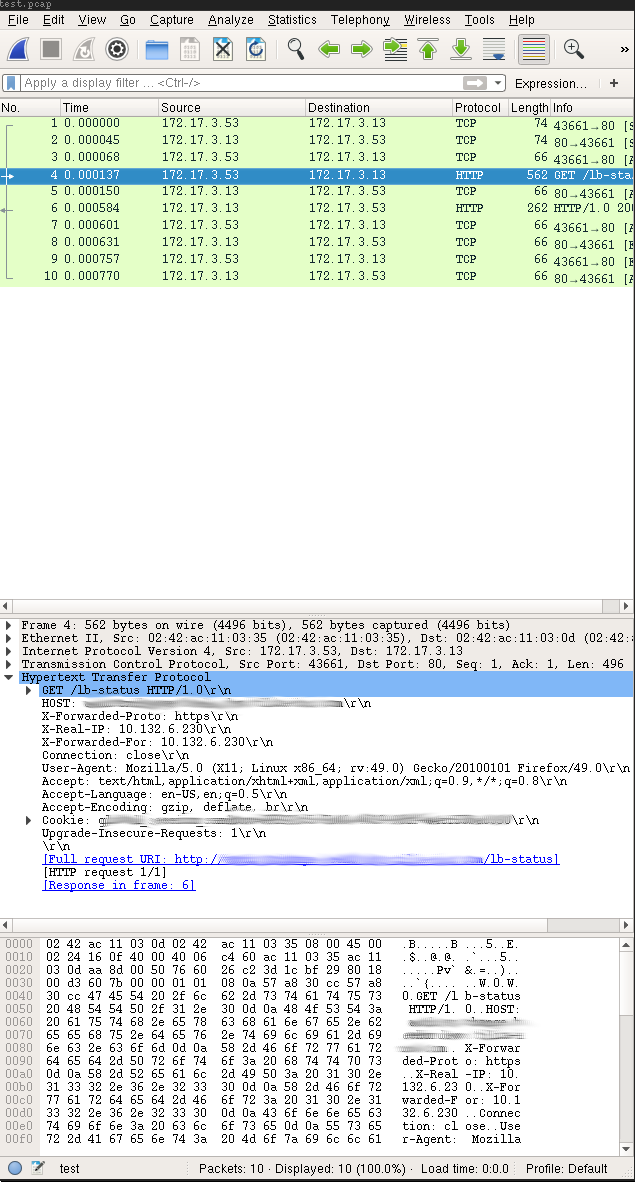
By selecting “Analyze > Follow > HTTP Stream” in the menus you will be able to just see the particular HTTP text protocol for this HTTP conversation which would look like this:
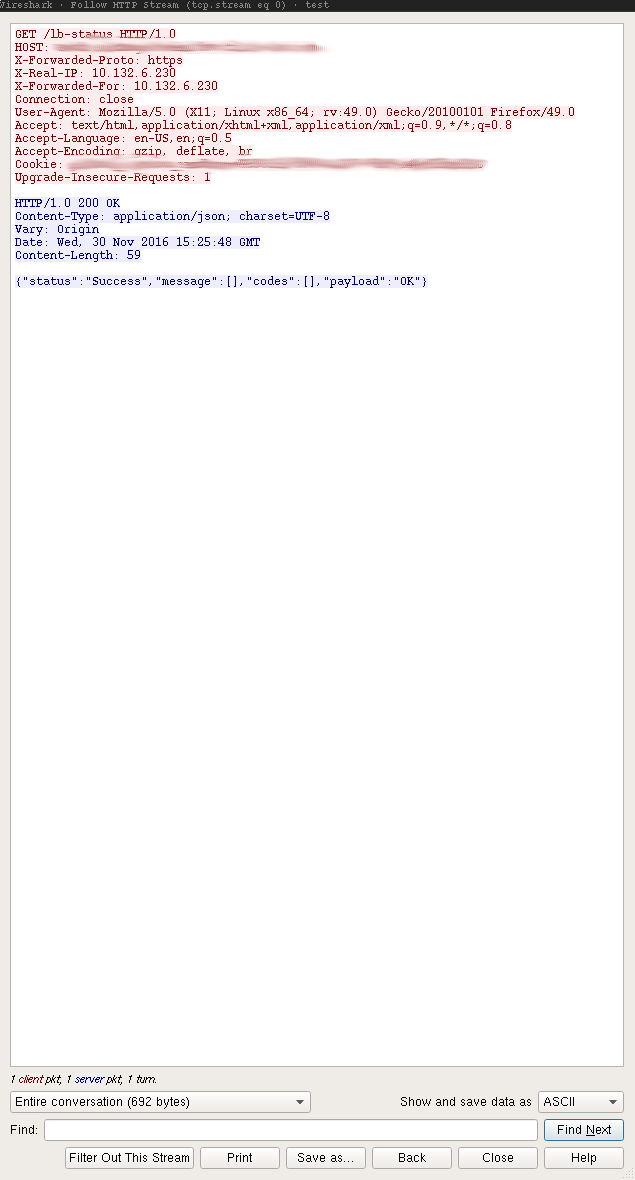
This is very helpful in figuring out “who said what” in a more complicated containerized development environment.