Reading the Green Squares
Part of my job is answering a question that doesn’t have a number: is this developer growing?
Not “are they busy.” Busy is easy to see. The people I mentor are early in their careers, and what I actually need to know is whether their work is changing shape over time — whether someone who started the quarter writing solo commits to their own sandbox is, six months later, opening pull requests against a shared service and leaving thoughtful reviews on other people’s code. That’s growth. It has a fingerprint, and the fingerprint is in the data.
The trouble is the first place everyone looks — the GitHub contribution graph, the wall of green squares — is precisely the metric that hides it. A dense green wall tells you someone committed a lot. It says nothing about where, what kind, or with whom. Two developers can have identical graphs while one is grinding commits into a personal repo and the other is reviewing pull requests across a codebase a million people depend on. Volume is not trajectory.
And the gap is only widening. Agentic coding — an AI writing and committing right alongside you — is detonating raw commit counts. A developer pairing with an agent can light up a month of squares in an afternoon, and the graph now reflects how much a tool produced as much as anything a person learned. When a commit gets that cheap, counting them tells you even less than it did a year ago. Which is precisely why this skill refuses to lead with the number: it reads the kind of work — reviews, pull requests, where the code landed and who leaned on it — the signals an agent can’t quietly manufacture on your behalf, and the ones that actually track whether someone is growing.
So I wanted a tool that reads the delta I actually care about. Point it at a person and a span of time, and tell me — in plain terms — what the shape of their work is, and which way it’s moving. That’s it. That’s the tool.
First, what MCP actually is
The tool is an MCP server, so a paragraph on what that means, because it’s easier than the acronym makes it sound.
MCP — the Model Context Protocol — is a small open standard for handing a language
model capabilities it doesn’t have on its own. You run a server that exposes
one or more tools: each tool has a name, a typed input schema, and returns
structured output. The client — Claude, in my case — is shown those schemas,
and when a task calls for one, the model emits a tool call, the server runs real
code, and the result lands back in the model’s context. Under the hood it’s
JSON-RPC over stdio (or HTTP); a tiny handshake, then tools/list, then
tools/call. That’s the whole shape of it.
The important part isn’t the wire format. It’s the division of labor. The server is ordinary, deterministic, testable code. It doesn’t reason. It fetches, it computes, it returns facts. The model decides when to call it and what to make of the answer. If you’ve read my post on diffing EULAs, this is the same split I keep coming back to: a deterministic core doing the mechanical work, a language model doing the judgment, and neither one pretending to be the other. MCP is just a clean seam for bolting the two together.
The server: facts, and nothing but
The server is called contrib-mcp. It exposes exactly one tool:
 login + date range ─► get_user_contributions ─► structured facts ─► Claude skill
                        ──── MCP server, Go ────      (JSON)          the judgment
                        deterministic · no opinion                    layer
It’s a small Go binary — mark3labs/mcp-go
for the protocol, shurcooL/githubv4 for
the GitHub GraphQL API — and all it does is wrap GitHub’s contributionsCollection
query, the same data that powers the green graph. You give it a username and a
from/to, and it hands back one JSON object: totals by contribution type
(commits, pull requests, issues, reviews), a per-repository breakdown, and the
daily calendar.
Two design rules mattered more than anything else, and both are about restraint:
It returns everything, and judges nothing. No impact score. No “this repo looks unimportant, I’ll drop it.” For every repository it touches it reports the stars, whether it’s a fork, whether the user owns it, the primary language, and the counts broken out by type. If it started deciding what mattered, it would stop being a trustworthy source of facts. The judgment belongs one layer up.
The schema is built for the consumer. The whole reason to surface per-repo stars and ownership and the commits-versus-reviews split is that the next layer needs exactly those signals to reason about growth — and it should never have to go back to the API for a second lookup. The tool’s job is to make the skill’s job possible in one call.
There’s a bit of real-world grit in there too. GitHub caps that query at one year, so a longer range gets split into year-sized windows and merged back transparently; the result tells you how many segments it stitched together. And the numbers carry their own caveats in the payload — private work the token can’t see shows up only as an opaque count, GitHub’s graph rules quietly exclude commits to non-default branches and forks, and the “canonical” total doesn’t always equal the sum of its parts. The tool says all of that out loud rather than pretending the numbers are cleaner than they are.
Why this is a good MCP use case
I think the interesting thing here isn’t the code, it’s the scope. A lot of the MCP servers people reach for try to be a whole API surface — forty tools, every endpoint, a Swiss Army knife bolted to the model. Those are hard to use well, because the model has to figure out which of forty things to call and how to chain them.
contrib-mcp does the opposite. It’s one tool, one question, one round trip.
It wraps an API that already exists, returns a shape purpose-built for the task,
and stops. That’s the sweet spot for MCP: a bounded, well-defined capability the
model can’t do on its own (it can’t reach GitHub’s GraphQL API and it certainly
can’t do the year-splitting arithmetic reliably), returning clean structured data
the model is genuinely good at reasoning over. Narrow scope is a feature. It makes
the tool predictable, testable, and easy for the model to use correctly every time.
The skill: where the growth question gets answered
The server has no opinions, and on its own it’s just a nicer way to fetch numbers.
The judgment lives in a Claude skill — a short instruction sheet that ships
next to the server. When I ask about someone’s trajectory, the skill tells Claude to
call get_user_contributions, and then how to read what comes back.
Its whole rubric is: lead with where the work landed, not how much there was. Concretely, it weighs —
- Ownership and reach. Contributions to a large, shared, externally-owned repo
count for more than the same volume in your own zero-star sandbox.
viewerIsOwnerandstarscarry this. - The type mix. A wall of commits to a solo repo reads very differently from a stream of pull requests and code reviews. Reviews especially — reviewing others’ work is a developer starting to shape a team’s output, not just their own. For someone growing, the appearance of reviews is one of the clearest signals there is.
- Depth versus breadth, and the temporal shape — steady engagement across the whole window versus a single heroic weekend, straight out of the daily calendar.
And one hard rule, the same one from the EULA tool: it never emits a single score. Growth is a judgment, not a number, and the data has real holes in it (private work is invisible, the graph rules undercount). The skill is told to give a reasoned, qualified read and to name what it can’t see — activity is not impact is not growth, and it says so.
That’s the payoff of the two-layer split. The tool guarantees the facts are complete and neutral; the skill supplies the judgment and carries the caveats forward. Swap the skill and the same server feeds a “compare two candidates” prompt or a quarterly report. The facts don’t change; only the question does.
Pointing it at a real subject: me
The honest test of a tool like this isn’t a junior dev I’d have to anonymize. It’s someone whose work shape I already know cold. So I pointed it at my own account, four years apart, and let the skill read both cold.
Here are the two years as the graph draws them — same scale, same person:
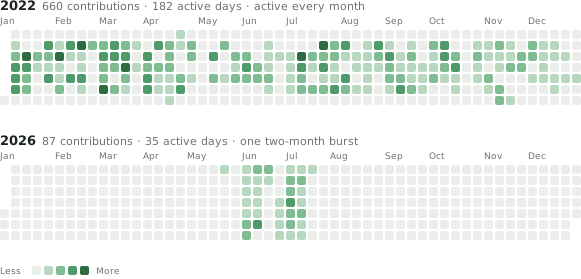
You can see the shapes before you read a single number. But the shapes are the easy part — the graph still won’t tell you that one of those years is full of code review and the other has none. That’s what the numbers underneath are for.
2022. 216 commits — but also 264 pull requests and 141 reviews, active
in every single month of the year, 182 active days out of 365. Nearly all of it
in repositories I didn’t own, under the brave and brave-intl orgs, including one
codebase with 23,000 stars. One shared service dominated everything: 567
contributions to it alone, a blend of commits, PRs, and over a hundred reviews. The
skill’s read, unprompted: a sustained, deeply collaborative contributor embedded in
a major shared codebase, heavy on review and pull requests — impact on others, not
just activity. That’s what a full-time senior IC year looks like from orbit, and it
nailed it.
2026. 81 commits. Zero pull requests, zero reviews. Every repository my own, all near-zero stars, and the whole year compressed into a burst that starts in June — 50 contributions that month, 35 more in July, and near-silence on either side. The skill: a solo build sprint across personal projects; clear activity, but little evidence of impact on others; bursty, not sustained. Also correct. That’s not a career — that’s me shipping side projects in the evenings, which is exactly what the public data should say.
One caveat on reading my own arc, and it’s the same blind spot this tool is built to confess: this is public contribution data — all of it. Brave was the last place I worked where open source was the job, where the work that mattered lived in repositories anyone could read. The roles I’ve held since run on private repositories, so 2026 isn’t me going quiet — it’s the tool honestly reporting that the work moved somewhere it can’t follow. That’s worth sitting with before you point this at your own team: for anyone whose real work lives behind a private org, the public graph is a keyhole, and the skill’s job is to say so rather than mistake the keyhole for the room.
Same person, same tool, and it drew two completely different shapes — because the shapes really are different. It didn’t flatter me and it didn’t invent a trend that wasn’t there. That’s the behavior I want when the subject is someone whose growth I’m actually responsible for.
Because now run that same read across four consecutive quarters for a mentee, and the movement is the whole story. The first reviews showing up in the type mix. The center of gravity sliding from their own repos toward the team’s. A single-repo obsession broadening, or a scattershot quarter finally going deep. None of that is in the green squares. All of it is in the same data, if you ask the right question — and the point of the tool is to make asking it a one-line request instead of an afternoon of spelunking.
What it is
A dependency-light Go binary that turns a GitHub username and a date range into a complete, neutral, per-repository picture of someone’s contributions — and a Claude skill that reads that picture for trajectory rather than volume, and tells you which way the work is moving in plain language, caveats attached.
The code is on GitHub — the server, the skill, and the schema they agree on. It sees public contribution data and nothing else, and it will tell you what it can’t see before it tells you what it found.
The green squares tell you a developer showed up. Whether they’re growing — going from writing code to shaping how a team writes it — is a different question, living in the same data, waiting for something to ask it out loud. That’s all this is: the right question, wearing an MCP server and a skill.